Monday, June 21, 2010

week 10 rotating league name

Rules updates first:

By a margin of 5-2 with 5 abstaining, we're keeping Net SB. The 6 hitting categories next year will be the same as this year (R, HR, RBI, NSB, -K, OBP).

This week we'll vote on pitching changes.

Not sure what are alternatives are, so I'll put out a yes or no poll for switching K/9 back to K and instituting a 5GS minimum to qualify for pitching categories.

Voting on those will close next week, at which point we can vote on whether a weekly acquisition limit is necessary to prevent pitcher streaming, whether a rule that just says "no pitcher streaming" is adequate, or whether we're okay with streaming so no rules against it.

On to analysis - which I largely phoned in this week and still got them up late, stupid work to do at work:

Below is real simple weekly wins chart. A W means you had more W than L that week, a T means W=L that week. A more refined approach might look at 5-6-1 like a tie, but that's more work, so you get the simple.


Jay Hey and Pawn Sho are on the Just Win Baby track, with Blazing not far behind. Half the league has won and lost roughly half their games, with a few ties thrown in for good measure. It looks like Van Ho managed to build up a nice early lead, but has been slipping a bit as of late. Of course, there are 3 teams on the bottom that have not been doing so well.

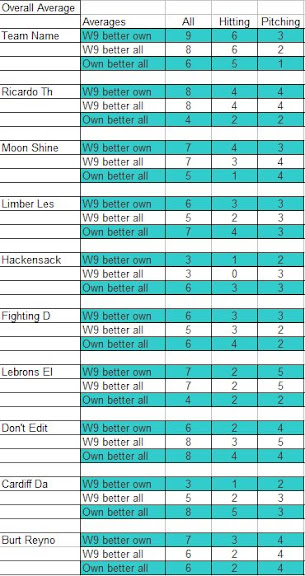
Here's another table:


Left column are the number of possible Wins or ties in a given matchup. Middle column shows how many times a team ended a week with that many W, right column shows the same for ties. Important note is that each matchup is counted twice in both columns (a 9-3 end result counts toward both the 9 and the 3), and the ties are counted twice (so there's been 33 matchups that resulted in 1 tie for each team).

5 and 7 wins are the most common (which makes some sense since they complement each other). I'm surprised by the amount of 9's and 2's. Also, we haven't had more than 3 ties, which is not surprising since it is very difficult to tie a rate category.

week 11 Brew Plop Mid Season Review

I've paid precious little attention to baseball over the last week plus because of the world cup. I suppose the fantasy baseball gods have noticed this and decided to chastise me. I'm not going to give in to them for at least another week though, so that's probably good news for whoever it is I'm playing this week.

In the meantime, I'll mention that we're halfway through the regular season, which largely means that flukes are now trends and that those with large leads have to be very bad to get out of contention and vice versa for those teams not doing well.

Here's something to look at:


What you see here are two different looks at weekly wins.

The first set of columns gives weekly W, L, and T and looks strictly at whether the # of wins on the week was greater than, less than, or equal to the # of losses.

Burt and Edit are leading the pack here with 8 weekly wins a piece (Edit with only 1 weekly loss after stealing a couple of ties). The only other team with wins the majority of the first 11 weeks is the surprising Hopslayer.
Moonshine has an even weekly record at 4-4-3 and Censored is just 1 week away from a winning record.

The second set of columns also gives W, L, or T, but in this case the measure is greater than 7 W (big win), greater than 7 L (big loss), or between 5-7 wins inclusive.
This stat could also be called "Burt kills everyone". More often than not, Reynolds has come away with more than 8 W on the week. Of Edit's 8 weekly wins, only half have been of the large, convincing variety. Moonshine seems to have gone binary for his wins, as all 4 of his weekly wins were also big wins.
I believe I may be challenging Lebron's Unicorn's 2009 title of "most mediocre" with only 1 big win and 1 big loss, but 9 close matches (which have mostly been close losses, unfortunately).

The Dunbars get the unfortunate distinction of lay-down losers, as all 7 of their weekly losses have been of the big variety. The Buhls may have more weekly losses, overall, but it appears that many of those have been relatively close.

With the exception of Moonshine who has lost or tied every close week, and it appears that most of the close weeks have evened out. That is, if you split the number of close weeks for each team equally between W and L, you end up with very close to the overall W-L record.

I may or may not do more this week, since it is the halfway mark. If anyone has anything they [i]want[/i] to see for the mid-season review, do it and I'll post it up here (or tell me about it and I might do it myself).

week 10 recap brew plop

It's a good thing it's World Cup time, cause I feel like baseball is quitting on me.

I fully plan on ranting out and out and calling it a "video update" later. For now, here's some stuff (earlier than usual, because I'm awake).

First up, regular year-to-date Roto rankings (10 points for the best, 1 for worst, 120 possible)

Jon and I clearly have the best two offenses, while there is a 5-way battle for the "eh" of the worst offensive side (everyone under 30 points).
Pitching-wise, it's Buten and Bartha up front (but not quite in that order) and Max, Kevin and Matt rearing up the rear.

Overall, Jon and I are stupidly evenly matched and that's... the topic of the rant I keep promising in video form.

So because I have that awesome ranking, but still managed to lose this week, I decided to look at it a different way... NORMALIZED.


Quick caveats (I think the same ones as I had the last time I used normalized scores): All averages are averages of averages or something like that, so they are not properly weighted. Also, the standardized scores do help sort out a small difference between the 5th and 7th player in a category, but they probably overstate a dominated category (since you can only win a category point once in a week, no matter how far ahead you are).

If you want to see the full chart and each team's tendencies, click here:


Anyway, the interesting things, to me at least:
1) Jon's hitting is even better than regular roto shows, which is from being exceptional in 3 cats and good/decent in the others.
2) Jon's pitching appears to suck, because he's nailing down HA and BB, but giving up W and K and only slightly better than average in ERA and Saves.
3) Bobby's pitching is really, really good.
4) Bobby's pitching is unbelievably good because his ERA is so much better than anyone else's, which seems unsustainable.
5) Scott's lefties are below average in every hitting category.
6) Bartha's shiners are below average in every hitting category except -K's, but they are a much greater liability than the Lefties offense, which gets most of its bad from terrible R.
7) Bartha's pitching is very good.
8) Kevin's pitching has been the worst combination of bad counters and worse rates.
9) Matt is very average thanks to a offense that has woken up and a pitching staff that hasn't.
10) Mike (again) is an average team in that both his hitting and pitching are very close to average.
11) Mike and Matt are both very susceptible to luck, including who they are facing that week.
12) I don't think I've mentioned Geoff in this post yet, but the only thing I can come up with for him is that he's the top of the lowest tier, according to normalized roto scores.

[yt]http://www.youtube.com/watch?v=PJ1XkvUQiHU[/yt]

Monday, June 07, 2010

Brew Plop week 9 recap

I'll walk you through The Journey of Week 9: The Analysis (worst movie title ever)

I started off looking at expected wins again, mostly because Jon likes them and he kind of killed the league this week.

Couple of notes: Max had a good week, but it would have been better had he not faced Mike would should have had an okay week. Kevin took a couple extra wins from Matt, mostly because Matt's fantasy team was drained because of a bike ride from Dayton to Cincinnati (congrats on the real life, Matt). Jon should have had an ordinary week and Geoff should have had a bad one, but luck rolled in and made it epically good/bad depending on your rooting interests.

Then I devised the theory that this week was an unusually bad week for hitting. Decided to see how this week matched up to the overall average (including week 9's numbers, which isn't technically the way to do this right, but it's free non-useful fantasy analysis, so deal). Also, to not go crazy, ERA and BA are both averages of averages, so they are not correctly weighted.

I looked at 3 variations of averages. Team's week 9 versus their own average, Team's week 9 versus league average, then team's own average versus league average.
To test my theory, I looked at hitting and pitching separately.


The table shows the number of categories (out of 12 categories for 10 teams, so 120 possibilities) where a team's number was better than the comparison (including accounting for the 4 negative categories).

So overall, this week was slightly better than an average week, but that was driven by pitching being better than hitting. Hitting itself was slightly down this week, though probably not much more than average.

In an effort to save some space, I will link the two team breakdowns I came up with to get the above summary.

First, here is each team's better than average matrix:


Second, here is each team's average and the overall averages for each category:


If you want to read this post with those two large tables visible, that's how I'll post it over at my fantasy blog/archive of these league updates.

Tuesday, June 01, 2010

Brew Plop week 8 recap

Can't remember that Mondays are Mondays if I have them off.

Here's the laziest entry I've done to date, it's just another look at the running best and worst weekly scores:


I'm glad that the Dunbars managed to have the best and worst Runs. I'm also glad that the Elbows managed 16 HR in week 7, but only 19 Runs in week 8.

I'm less glad for the 5 IP Hops vs Edit matchup that produced a 0.000 tie in ERA. With that matchup, we can officially start discussing fixes for next season. The goal will be to value SP and RP equally. Thinking we'll have to have a min IP and probably change Hits Allowed to Batting average against. Feel free to discuss below.

Rotating league name week 8 recap

I was busy Memorial day weekend and though the public has spoken, Shane hasn't come up with anything I can put up here.

Here's your lazy Tuesday morning update of the best and worst of us:


Since I last updated this after week 5, 15 of 24 possible achievements have been met or exceeded. Notably, every hitting category best has been claimed in the last two weeks. Perhaps my personal favorites are Jay Hey setting the worst BAA record in week 7, then rebounding to set the best in week 8 and A-Fraud setting the worst for ERA while his hitters set the best OBP. I can only assume that his hitters were also facing his pitchers (and refuse to do anything to back up that claim like look at the week's box score).

On an entirely different note, A-Rod gets a lot of flack on a regular basis (often rightly so), however this weekend he showed genuine class after lining a double off Indians P David Huff's head. There are many more important events than occasionally showing class, but I felt compelled to remark on this particular incident.

Rotating League Name Week 7 recap

Since Shane wasn't the big winner this week, I decided to not keep the running tally of weekly bests and worsts. Ever. For this week. And last week.


What you see here is how a team can expect to finish a week given their past performance in each category. What I did was figure out how many weeks (out of 7) a team won, lost, or tied a particular category, then figured out your winning percentage for that category alone (using the same methods as ESPN, where T= .5W +.5L). What you see below is how each team did in each category. If a team won 60% or more of the time, they can expect to win that category each week. Less than 40% and they can expect to lose. Anywhere in between and it's a toss up from week to week.


I used this green color because it's very ugly.

Of note is that there are 4 categories that have been won 100% of the time. Hunt's Wins and Bartha's BB, SV, and K/9. Given this, it is a surprise that Bartha is not doing even better. Also, there's only 1 team that hasn't won a category and that's Corley's RBI, or rather, his lack there of. There's a whole lot of ugly for some people and it's never good when you have several "assumed loss" categories but few "assumed win" to go with it. The take away from this is that you can probably predict at the beginning of a week which categories a team will take and which are toss ups for that particular week.

Speaking of predictions, last week I used some method I don't remember (I think using YTD stats) to predict the outcome of each matchup. Here's how that went:


Well the prediction machine (notice how they are no longer my predictions, but the machine's) had a decent go of it. Only 1 upset (based on overall standings) was predicted. That matchup ended in a tie. Of the other 5 where the computer chalked, 3 were wins and 2 were upsets. As one of the upsets had 3 ties (and actually had the correct number of wins for Streeter's team), and the other upset was my team winning instead of losing, I'm fairly happy with the results. As expected, the results were only barely better than a coin flip.

Let me know if there's some kind of breakdown you want to do and I'll be happy to post it. Barring that, feel free to send along ideas for me to do.

Tuesday, May 25, 2010

Far too busy reading Lost forums (and doing work) at work this morning. I'll post something later. Unless I'm dead, or have some other malady.

Update: Eating or walking at lunch is for losers.

Back to the old category wins (by popular request according to the survey).
So here's the skinny, I calculated the number of weeks out of 7 a team won (or tied) a category. I then calculated the winning percentage for that category, using the same method as ESPN for our standings (Ties count as half a win and half a loss). Then, I figured out which categories you've locked down for Wins (60% or over), which you stumble through for Losses (40% or less), with the middle counting for tossups. Those numbers proved rather arbitrary, but if you said a team had to have 6 or 7 out of 7 (or lost the same), this analysis doesn't do all that much. Anyway, I took the number you bomb and the number you nail and calculated a win percentage, which doesn't mean much since there are a lot of tossups. The actual number of expected W or L is more indicative of success (as seen by Jon's 6 expected wins every week and his brother's 1).


I assume you can figure out which team is which (it made it a lot easier to calculate using Excel, so you're stuck with it).

For full results on each team/category see below.


I'll probably go through these in more detail in a video recap (assuming it happens this week). Of note, the only sure thing (100% or 0%) on the hitting side thus far is the Dunbars winning SB. I'm a little sad that the schedule thus far has already taken out any potential 100% v 100% matchups. Also, since thus far 3-5 people are using the same pitching strategy, Bobby doesn't have 100% in 3 categories thus far this year. Thus far.

Update: This is a video that you can watch with your eyes.

Rotating League Name week 6 recap

Chapter 6: In which I crap my pants

Whenever I listen to audio books, I always want the old Brit speaking to say that title. Anyway, here's stuff you might care about.

Decided to see how well overall performance can predict weekly performance in a given matchup, so here's a picture of what I found:


The numbers shown for each week 6 matchup shows how many categories were won by the team with the better overall numbers through week 5. That is, if team A had more RBI year-to-date than team B, and team A beat team B in RBI, that got scored a 1 or W for prediction. If either the YTD or matchup ended in a tie, it was scored a .5 (used the same rules as our standings as ties counting half a win and half a loss).

Of note is the Kid-Pawn matchup where every single hitting category went against the past performance (4-2 Bartha, instead of 2-4). At the same time, every pitching category in that matchup went exactly according to the past (though Bartha almost blew it trying to chase Saves history - which incidentally was the only best/worst change from last week, so I'm not bothering to update it this week).

At the bottom of the picture are measures of how well YTD predicted this week's outcome. I actually ran the figures using the current data (through week 6) first because: 1) I thought it would be easier and 2) I forgot that I had the cumulative stats through week 5 handy in the same spreadsheet.

In general, the predictive power based on this one small subset was somewhat better than just flat out guessing (.500). As you might expect (or maybe not, who am I to know what you expect?), adding this week's cumulative stats produces better overall guess, but not that much better than before. The pitching categories seem to follow form a little closer, and so are more predictive (the hitting categories were dead even). I believe this is partly because the league is set up with extreme hitting strategies (this year at least) and because the presence of several rate-based categories means that one good or bad week is more mitigated than in the counting stats. Indeed, when I separated out the rate categories, they were correct 2/3 of the time, versus around 52% each for the positive and negative (and net) counters.

So, after showing that the predictive power is potentially a problem (I mean limited, but I was on a roll), I decided the best way to use this information would be to make predictions for the next week. Here that is:


Yes, I'm going out on a limb and saying that these scores will be closer to correct overall than just picking 6-6-0 for each matchup. Depending on whether this is true, there may or may not be an update on this next week.

My bold predictions (or those of this system I'm using if they are far off) include 4 out of 6 matchups ending 5-7. Shown in gray, there's only one predicted upset (Rod Beck's Counting). If nothing else, this little exercise allows me time to sit around thinking of (good?) ways to combine team names.

Monday, May 24, 2010

brew plop week 6

Dog Days of May:

I'm not going to actually reference the title, as it really only serves as a way of showing that I changed this weeks post.

Bringing back the weekly wins stat. If you don't remember, a weekly win is what would happen if each week was winner take all, so a score of 1-0-0 instead of some numbers that add up to 12.


An even half of the league has 3 wins out of 6 possible to date. It seems like there are quite a few more ties this year than in years past, perhaps because of the scoring changes. I imagine that if you included relatively close scores (i.e., 6-5-1), the number of ties would go even further up. In fact, the number of almost ties (two losses at 5-6-1-) helps explain the oddity that the Shiners are 4th overall in the standings, but have more weekly losses than wins.

But here's yet more evidence that the league is rather competitive top to bottom (excepting maybe the Lefties, who look about as bad as most lefty-lefty match-ups).

And because you asked for it (after I told you to want it), here is the updated weekly bests and worsts:


I'll point that out the best and worst HR weeks were actually in the same match-up (though the Hoopster matched the worst in week 6).

For the bad Wins and Saves, there are so many 0 occurrences I didn't bother to list the weeks, but instead listed the culprits and how many times they "achieved" the feat.

Video to come later.

Monday, May 17, 2010

rotating league name week 5 recap

Far too involved league analysis:

Couldn't decide what I wanted to do for this week's update, so I just did way too much for way too little.

The table below shows expected win values next to actual win totals and the difference between the two.

Here's how we got there. I found the average values and standard deviations for each category. I then classified each weekly category result and assigned that result a point value (high outlier +2, above average +1, below average 0, low outlier -2). I figured you had a reasonable expectation to win a category by being above average in it, with bonuses/punishment for extreme showings. I'm pretty sure I treated negative categories correctly. If you're at all interested, I used 1.75sd for the outlier break, because there were very few above the standard 1.96. I then added up all those categories and weeks and got an expected points total (451), which I then scaled to the number of possible wins (360 to this point). The actual total of wins is lower than 360 due to ties.


Anyway, here's the result:


A negative difference means based on your teams performance, your team would have fared better against an average team than against the teams it actually faced. The biggest caveats are that this is actually less precise than the other way I did expected wins, as this assumes an on/off for winning or not, while the other rates your chance to win a category given others' performance. (old way explained here). This way was slightly easier to look at the season as a whole though, instead of just one week. It also helps show how much luck and opponent can affect the standings.

And since Shane is still kicking names and taking ass, here's the ongoing best (with a new best and worst from week 5):

Brew Plop Week 5

Griping it up:

Because I lost epically to my fantasy nemesis (that's right, it's gotten that bad after this loss and last years final), I had time to stew and think of several ways to make myself feel better.

First up, a new thing I hadn't though much of until this weekend:


Through week 5 in our league, there have been 1561 runs scored and 1436 RBI compared to 2060 hitter's strikeouts (only 1710 pitching K's thanks to the minimalist style of several). Since there have been more -K than either R or RBI, it would seem that a "good week" would be one where you had more R or RBI than -K. Likewise, since there are more R and RBI combined than K (by a lot), a "bad week" would be one where your hitter's strike out more than those two stats combined.

The above table shows the number of weeks a team had more R or RBI than -K. It also shows a negative count of how many times a team had less combined RBI and R than -K. At the bottom of the table, you see the average, min and max number of wins had when having a "good week" or a "bad week", as narrowly defined for this post.

There are nine instances of good R week. In six of those instances, the team managed 7 or more wins (win totals of 6,5, and 3-my terrible week 5- were the others). There are also nine instances of good RBI week. In five of those, the team won 8 or more, but the remaining four were just okay (6,5,5,3-see above).

There are 13 total "good weeks", meaning that there were 5 weeks where a team was good in both R and RBI. Those five weeks resulted in win totals of 10 (dalek), 8 (edit), 8 (unicorn elbow), 8 (hops), and 3 (who do you think). In general, if you have a double good week, you win the week. It also appears that R is a better indicator than RBI for how well your team might do.

On the flip side are "bad weeks", which seem to be more straight forward. If you have a "bad week", your team will most likely win only 4 games.

Because Jon asked for it (and I'm still feeling sorry for myself), here are week 5's expected wins compared to actual.


Of note, I also tried incorporating in ties this time (by counting each tie as half a win), but it didn't change the overall picture by much.

Not a lot to comment on that doesn't make me feel angry and bitter. Interesting though to see when the match-up projects less than 12 wins, who picks up the extras (Dunbars and Reynolds this week).

Lastly, here's a longer term view of the expected wins.


Lots of fluctuations here that you can sort through for yourself. All the same caveats apply to this as to regular roto rankings (i.e., doesn't adjust for extreme weeks, no account for punting a category).

Video updated: My glasses were falling down and I look kinda wonky. I'll try to get someone better to do it next time.

Monday, May 10, 2010

rotating league name week 4 update

Here's a couple of things for ya:

First up, how would your team being doing in a roto league:
Congrats to the Ninjas on their earned run-less week.

Also congrats to the Frauds for having the most wins this week.


Here's the link to the full standings:


Not a lot of surprises (to me at least). The JayHeys would take the biggest tumble in the rankings, but that seems to be due in part to a strategy that seems to focus on dominating a few categories and just being competitive in several others (to pick off wins in weeks where the opponent is also weak in a stat). Correct me if I'm wrong there VH2.

Also interesting is that the 4 highest rankings from pitching come from closer heavy, starter heavy and balanced teams.

Since Shane is still kicking butt and taking names, here's his requested running best and worst total:


Notice we set 3 best's this week, but also 5 worsts (on top of tying the 0 saves mark again). Also notice I purposely show the record as Labia Skull and another as Brown Fang.

brew plop week 4

Here's the number of wins each team had after the first 4 weeks each season:


Here's some caveats first: For those who don't know, the first year of this league, we had 16 teams. We redrafted completely from year 1 to 2 and dropped 6 teams, so there's no comparables for the newly managed teams. Obviously, the two teams with new owners (marked in gray) won't have the same strategies as the teams they took over.

I adjusted for # of win inflation since we're not working on a system based on 12 categories/wins instead of 10. I also ignored losses/ties for simplicity.

Here are my initial thoughts on the through 4 weeks records:
1) The team with the best record after 4 weeks also had the best record at the end of the season
1a) but in previous two seasons, the team with the best record after four weeks was well ahead of the 2nd place team, which does not appear to be the case this year
2) The Lefties have made slow starts an annual occurence
2a) they've also made the playoffs every year
3) The Bulls are better when they don't draft the best (remaining) Indians from 1997 in 2008
4) Hopslayer is off to his best start ever, by far
5) The Dunbars are not off to their best start ever
6) I can't decide whether to refer to a team as a group (plural) or as a singular entity
7) my start to last season was pretty darned good (8-2 for 3 weeks, then a 5-5)

Still more to follow (at least the video).

Update: No more to come, here's the video recap:


Hoopslayer. Classic

Monday, May 03, 2010

rotating league name week 3cap

Congrats to Streeter on managing the last team to tie. Let's see how long he can put up wins and losses without being just mediocre!

I might do more later, but here's the updated weekly best.

[link]https://blogger.googleusercontent.com/img/b/R29vZ2xl/AVvXsEh9Y20FF8yZ8PDURDxsY4gM4_HXfCPJwiMZjPYlVqeBVjBm_4vxtCUXBpqA23GwuSEZj99a4ZOxJkW733MJR4AGoLNy-QNBAmNeqWZYUhHvG-EW0QgXr1GVEm4fXxdXaE74zbEw//[/link]

Interesting that the Deranged Detroit Junkies managed to set 3 new worsts and 1 new best all in the same week. Also interesting because the team managed to barely strike out while setting a new low in OBP.

Brew Plop 4cap

Standard "if this were Roto" scoring

[image]https://blogger.googleusercontent.com/img/b/R29vZ2xl/AVvXsEiz6lBB9RL2Ly1iXT8d4RlTaAuz30xRSsgLGtz-bd-TRs2k4KIiApQK3He8vJEq3V08_yp0diFyhU9vm04bREJsTrQzNV8W03xJfIays9edNK0eeO0bn-liQewoVBap-Rzco756//[/image]

I'll point out that the top 2 spots get their points completely differently (Burt is all or nothing, Daleks are decent everywhere. Same can be said for the bottom two, who experience the same thing (except more nothing and less all, or replace decent with less than adequate).

Also of note is the first 10 win (and first 2 win) weeks. Thanks Max for having no offense except steals.

I will post the full roto table on my blog later (probably later today). I wouldn't mind posting it in some sortable form instead of pictures. If you have tips for doing that in HTML (or blogspot shortcuts) let me know.
Update (2): [link]http://dionysum.blogspot.com/2010/04/brew-plop-expanded-week-3-roto.html[/link] There's the link to the full table. Let me know if you have a preference in the "large image file" vs "somewhat unreadable but exportable table" full results battle.
Update: Instead of doing that, I made the league's first video recap. Check it out.
[yt]http://www.youtube.com/watch?v=sA7fXWBy_8E[/yt]
If you are capable/interested I highly recommend that different people do something like this each week.

Monday, April 26, 2010

Brew Plop expanded week 3 roto standings

I think this may actually be the table instead of just a picture of the table. Now you too can download and sort if you feel like.

Rotating League Name Week 2

I think I figured out why Shane wanted a running total of the weekly high scores. Congrats to him (and condolences to Rod Beck) on the first 12 category sweep in league history.


[link]https://blogger.googleusercontent.com/img/b/R29vZ2xl/AVvXsEhf0r0RuImU_C6ryq0_zJZ7Btpxp9DBeRJHrRsJ8rxW-Wbx7Wd-9uLus3ccVjOR9VWa-VqnYGwQ8kPOcTos_YifTO3mOnMHwOcnNyLYueQ0mcmEhFIEWM2ylenhjaw8Zbre7cfn/s912/bestthrough2.JPG[/link]

I think my favorite discovery of this process is that the Van Super's have the best and worst in runs, while the Brooklyn's have the best and worst in wins, in only two weeks.


I also added this:


[link]https://blogger.googleusercontent.com/img/b/R29vZ2xl/AVvXsEi_mO46FWKU6ay66N72qN2Zg9nuBgvqdbHPwxoXF6xbTwNo6Jr8cMZ4T_9tPigvsTWJiRDNEL_0elQ6iM5VIm5HAcaDcIRixIQ2Cns9Gkhh_F0sDpAre-RW5fNv1CbgAE0MNcNH//[/link]

To get the expected wins, I summed the probability that you would win any particular category this week given the rest of the scores this week. For instance, if you had the highest amount of HR this week (13), you would win that category in 11 of 11 possible matchups.

What I see are two major standouts and a personal gripe. Shane was going to do well against anyone this week, but did even better than expected, while the Handlebars had an average week that netted nothing. The four worst teams this week played each other, so the Kids and Obamers got luckly to win some games. On the other hand, Brownie and I played each other and both came out with not so much to show for it.

Brew Plop through 2

Well, we mostly survived the week where half the MLBPA hit 4 HRs a piece.

The goal of today is to answer two questions: First, how would I have done against other teams.

Bam, drop an apple on his

[link]https://blogger.googleusercontent.com/img/b/R29vZ2xl/AVvXsEhtCWGkLQptBHWAPgNTXRyOgISQOmjWgahPr0MlOmJhTzEMeyZoXBwb2B4xOJB_EWsCYtceehNMcgqf6wBT6me5fzOcAvA3zDr4-Ii76pOwhlQqR5QCh1lpBLA4jMiPh2Su1VRU//[/link]

First, the methodology - I sorted through the weekly score and ranked each team based on how many teams they would beat (not tie) that week with that score (i.e., if you're tops, you get a 9, if you're tied with the second best score, you get a 7, if you're the lowest you get a zero). Added those scores up for all 12 categories then divided by 9. In essence, created a probability chart for each category.

There's quite a bit of rounding error, but I vagued that away (that is ignored it) by not accounting for ties at all.

It appears that most teams did about as well as they could expect. The former Tots and I both got a little hosed because we had two relatively strong teams going against each other. The Unicorns picked up a little something extra because their strengths and weaknesses largely match the Lefties, who got out muscled in a few categories.

There's more there that is interesting, but I won't force too many explanations on it.

The second question of the week is who have been the best and worst performers thus far. I'll try to update this list semi-regularly throughout the season. Burt appears all over this list, evidently due to his all or nothing strategy (and extreme lifestyle).


[link]https://blogger.googleusercontent.com/img/b/R29vZ2xl/AVvXsEg68aRNyN7y8oLcoN13I9aEF7SxXNRZtKFSdmsiIbq6ZupVKFmFuTd7hcKu_g3VTjFQR7lYsqkwdUdMb1O7jOqBq10xfHQvvmtXOkIk3eM1_ooojwJ-0wlG9NTYScxXAAblF2-6/s720/bestthrough2weeks.JPG[/link]

Monday, April 19, 2010

Rotating League Name Week 1 results

are not good for me, any way you slice it.

There were 3 9-3-0 blow outs this week and only 1 particularly close matchup (Brooklyn v Obama 6-5-1).

To get a better sense of how your team did compared to the league, instead of just the 1 person you played, here's a table of normalized categories.


Because I didn't feel like doing regular roto scores, I instead came up with the summary statistics (average, median, mode, st dev) for each category through 1 week. I used that to normalize each category, then added up the results (or subtracted when appropriate). What you (hopefully) see above is the rankings based on the summed normalized scores. This is a long way of getting at how your team is doing overall, instead of looking at just how your team did versus the team you were placed against. Enjoy


For more on standardized scores, including a category by category table: [link]http://dionysum.blogspot.com/2010/04/week-1-results-brew-plop.html[/link]

Monday, April 12, 2010

Week 1 results (Brew Plop)


Above are the normalized scores for each team and category. The number represents how far above or below average a team is in a specific category. For negative categories (Hitter's K, HA, BB, ERA), where lower is better, a team is better off being below average. The total score is derived by adding the positive categories and subtracting the negative categories.
The red highlights show the two outliers of the sample (which is only a sample of 10, so none of this is particularly significant). The Dunbars were unable to score runs and about the only thing the Bulls did well was not give up runs.

Thursday, April 08, 2010

Rotating League Name Draft Analysis


Here's a load of draft analysis since we don't have any weekly results to speak of just yet.

The leftmost columns show the total and average ESPN value for each roster as of whenever it was I copied it (same as the last table). Some wide variation here, from Obama loves my team almost getting even money to the Ninjas overspending quite a bit. The caveat here is that ESPN values are for standard scoring leagues, so it is entirely possible to have spent the "right" amount on a player who isn't particularly beneficial with our scoring or "overpaid" for someone who fits our criteria quite well.

Overall, we as a league got $214 of value from our $260, meaning we spent 21% more per pick that ESPN recommended. This is not entirely surprising as we spent our money on 21 players instead of the 25 in ESPN standard leagues (19% difference there).

The second set of columns show how many players on each roster were overspent for, underspent for, then over- or underspent by more than $4. If they don't add up to 21, that's because a team had one or more players at the exact ESPN value.

If I get the time, I'll post each teams biggest reach and best deal later this week.

Update: I made time


Most of the overspent guys are who you would expect (except for me overspending on Mike Gonzalez, how dumb am I?). The underspent appear to mostly be veterans who the ESPN list liked, but that no one saw much upside on for a keeper league.

Note: If anyone else does this kind of obsessive tinkering with the league numbers, let me know and I'll be sure to throw it up here.

Thursday, March 25, 2010

Drafting Analysis


The above picture shows the more useful set of draft information, as has 3 measures of the expected value of each teams roster (six if you count the sums separately from the averages, even though they tell you the same thing) (12 if you count the sums, averages, actual numbers and rankings all as separate, but that might be dumb).

The 2009 player rater shows what ESPN says a player did last year. Obviously players that didn't play last year got zero's, so all the prospects really bring down the average. Even worse, several players who came in, did poorly, then went to the DL all year ended up with negative numbers. The former blithe tots maxed this out, while moon shine has the lowest values (probably because of Liriano's way negative).

Second column shows the ESPN dollar value. Last year's champ leads the dollar values and again Moonshine is at the bottom (a running theme for this table). I doubted whether to even put positional rankings in, since the rankings for pitchers completely skew the other numbers. I figured the rest of the table was not particularly useful, so might as well add quantity.


Part 2 is mostly draft analysis. The big issue with all of this is the keepers. Didn't really matter which 4 keepers you had in what order, they were randomly assigned. It might even out a bit since it happened to everyone, but without putting too much thought into it, it seems like it flaws the rest. I also had to assign values to non-drafted players (since it was rosters as of this week, after people made changes already). I gave all non-drafted players a value of 201 (ESPN gives undrafted players 260 or 261 since their standard leagues pick that many players).

Anyway, here's the rest of the flawed rest. The first two columns show the number of players that were taken for each roster either before or after their average draft position (ADP). The 2nd two columns show how many players on each roster were taken more than 10 spots before or after their ADP. The Bulls again had the least reached for players (thanks auto-draft bot) and the most late round picks (again, thanks draft bot). Those unicorns had 10 players (of a roster of 20), that were reaches (thanks homer calls!). The limber lefties evidently couldn't wait for players, as they had only 3 later bloomers.

Almost all of this means nothing, but here it is for you anyway.

Post Draft Roto Rankings


I'm hoping to get something or things up about post-draft rosters and such before the season starts. It may well happen.
update: It did.
This is less than analysis but it took some doing.
[image][/image][link]https://blogger.googleusercontent.com/img/b/R29vZ2xl/AVvXsEhqV-yDUIEW0S_1yc5okVhKs9UomEGt-JWCGddh16wxSZBhp_RbcWIPAATvAzy0tjGCBybIWPUYvv3Al3JWEr6hMXyBgvfn7ePwL5J1oNky6L7SjShPMP0Jh37N28Uzqg5k9L_X//[/link]

I took the preseason ESPN 2010 predictions and took the average per player on your roster. Note this is highly inaccurate because it assumes that the bench spots play all the time, which cannot happen. Also, all the rate categories are averages of averages, so it doesn't take into account expected AB or innings pitched.

It should give you a decent idea of what categories you have the players to expect to win versus which opponents.